


Please enter the answer below before you can view the full text.
1-1=
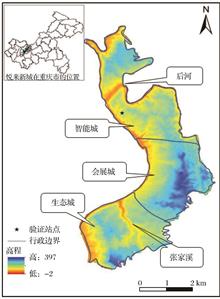
The distribution of local surface heat flux in mountainous cities is quite different from that in plain cities because of complex terrain and changing climate. In order to explore the spatio-temporal evolution law of surface heat flux during the urbanization process in new mountainous development city, the spatio-temporal evolution law of heat balance process of different land use types and heat flux process before, during and after urbanization in Yuelai New City were analyzed by satellite remote sensing image data, LUMPS and SEBAL model, the effect of land use/vegetation cover on surface heat flux was also discussed. The results show that, (1) the net radiation flux and difference of various land use types in Yuelai New City reached the maximum in July and the minimum in January, vegetation coverage was one of the factors affectied sensible heat flux of different land use types. the order of latent heat flux was forest land > farmland > unused land > residential land, and the order of soil heat flux was unused land > residential land > forest land > farmland. (2)The urbanization process increased the area of low net radiation value in Yuelai New City, and sensible heat flux showed an increasing trend and accounted for the largest proportion in the energy output. The low value area of latent heat flux gradually expanded to the north and south. Soil heat flux and sensible heat flux were higher in the area with low latent heat flux. The distribution rules of soil heat flux and sensible heat were basically consistent, and both showed an increasing trend. (3)The correlation between soil heat flux and land use area was the best among the energy output factors. FVC had a greater impact on heat fluxes than land use area. Residential combined land was most closely related to FVC, and latent heat flux was most affected by FVC.
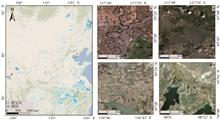
The high spatial and temporal resolution Sentinel-2 images are increasingly becoming the primary remote sensing data source for surface water extraction.A comparative study of the extraction effects of various water index methods based on this satellite image is a significant reference value for improving surface water’s remote sensing monitoring capability. In this study, the seven water indexes (NDWI, MNDWI, AWEInsh, AWEIsh, WI2015, CDWI and MNDWI_VIs) are used to extract surface water from four sample areas with different combinations of surface water types in North China, Northeast China, the middle and lower reaches of the Yangtze River and Northwest China.The water indexes’ accuracy is quantified using Sentinel-2 MSI images on the GEE (Google Earth Engine) platform. The results show that, all seven water indexes generally can identify surface water well, but there are some differences in performance when extracting different types of surface water bodies; the NDWI index underestimate the distribution of surface water in transient water bodies (e.g., paddy fields, floodplains, etc.) and have a high miss-score speed; while the AWEInsh, AWEIsh and WI2015 indexes have an overall tendency to overestimate and have a high miss-score rate; the MNDWI_VIs water index maintains the highest extraction accuracy in areas with complex water index; in the field of monitoring water changes in long time series, the performance of the seven water bodies is generally consistent with the conclusions obtained based on single-view imagery. This study provides an essential scientific basis for carrying out surface water monitoring in different water bodies.
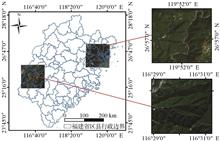
Aiming at the problem that dark feature information such as water bodies affects the accuracy of terrain shadow extraction in mountainous areas, this paper proposes a terrain shadow extraction method based on the first principal component features and spectral features of ground objects. Firstly, the spectral features and the first principal component features of four typical ground features including topographic shadows were analyzed, and the shadow component (PCA1) and the water component (NDMBWI) were established to construct the Normalized Shadow Index (NSI). Then, the dynamic threshold was constructed by analyzing the two-dimensional spatial distribution between NSI and NDVI. Finally, the image information is segmented to obtain the terrain shadow area. The test results show that: (1) Compared with other methods, the dynamic threshold method based on NSI has the highest overall accuracy and Kappa coefficient (about 0.893 and 0.759). The three statistics (Range, Standard Deviation, and Coefficient of Variation) of the reflectance in the shadow area are the lower, indicating that the method can effectively remove the influence of water and other dark ground objects, and accurately extract the shadow; (2) The dynamic threshold method based on NSI can extract topographic shadows in different phases and different study areas with good results. The topographic shadows are highly distinguishable from water bodies, dark features and buildings, and can suppress the influence of cloud shadows to a certain extent. The algorithm has good stability and applicability.
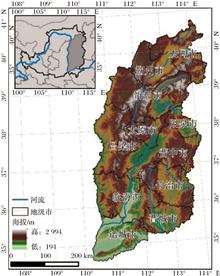
Shanxi Province is one of the most important ecologically fragile areas in China. Scientific assessment of ecological vulnerability and its driving forces is an important basis for formulating ecological protection and improving ecological environment. However, previous studies on ecological vulnerability in Shanxi Province were often based on administrative boundaries, and there was nearly no grid scale to study the different characteristics and driving forces of ecological vulnerability of Shanxi Province. In this paper, remote sensing and GIS technique were used to evaluate the different characteristics and driving forces of ecological vulnerability in Shanxi Province from 2000 to 2019, combined with PSR model, Spatial Principal Component Analysis method and Geographically Weighted Regression method. The results show that the main ecological vulnerability of Shanxi Province is moderate, the ecological vulnerability of the central basin and the western loess Plateau of Shanxi is very poor, and the ecological vulnerability of the "Duo-shape" mountains is better. Considering the distribution of ecological vulnerability of different land cover, grassland, water area and cultivated land are dominated by moderate ecological vulnerability, forest land is mainly covered by mild ecological vulnerability, and construction land and unused land are most influenced by severe ecological vulnerability. The overall migration of ecological vulnerability gravity center is going to the south. The order of influencing factors on ecological vulnerability are population density>GDP>biodiversity abundance>NDVI>SHDI> aspect, respectively. According to the distribution and change characteristics of ecological vulnerability, Shanxi Province is divided into Core areas of ecological protection, ecological comprehensive concern areas, ecological optimal-concern areas, ecological restoration management areas, and ecological potential management areas, and the corresponding strategies are optimized for protection ecological vulnerability.
Road ecosystem monitoring is the foundation and key link for understanding the quality status and causes of changes in road ecosystems, and is of great significance for road ecological environment protection and sustainable development. Due to its advantages such as large-scale, multi-temporal, high-precision, and comprehensiveness, remote sensing technology has gradually become the main means of road ecological monitoring. This article reviews the domestic and international research progress from three aspects of remote sensing monitoring with landscape pattern, vegetation status and species diversity monitoring, summarizes research trends, points out the main problems and challenges faced by current research, and proposes future development prospects. Research has shown that (1) remote sensing monitoring of road ecosystems covers a wide range of aspects, with rich research results. Different remote sensing monitoring methods have their own advantages and disadvantages in application. (2) At present, remote sensing monitoring of road ecosystems still faces many challenges, such as insufficient monitoring during road construction, weak targeting of monitoring and evaluation indicators, limited remote sensing monitoring based on road characteristics, and unclear delineation of road boundaries. Therefore, future research should establish multiple indicators from a multidimensional perspective to evaluate the ecological status of the road construction period. Based on the linear engineering characteristics of land transportation facilities, targeted monitoring technologies should be developed to improve monitoring efficiency and real-time performance.
Coupled with the physical environment of the city and human social activities, the study of the spatial and temporal evolution characteristics of the city's spatial structure can clarify the current needs of urban development and provide references for the layout of territorial spatial planning. Based on multi-source geographic big data, the spatio-temporal evolution characteristics of urban spatial structure are portrayed in terms of both hierarchical structure and circle distribution from the perspective of coordination of urban static-dynamic system, taking the main urban area of Wuhan city as an example, using night light remote sensing data, POI data, land use data and road data, and drawing on the concept of coupled coordination degree. The results show that: (1) in terms of temporal changes, the spatial structure tends to be perfect in the main urban area of Wuhan between 2010 and 2020, and the scope and number of urban centers also appeared to extend and increase. (2) The distribution of advantages and disadvantages of spatial structure is unbalanced in the main city state for ten years, forming an overall pattern with the city center and gradually decreasing along the circle gradient towards the periphery from the perspective of space. (3) The portrayal of characteristics of urban spatial structure coulping urban static-dynamic system based on multi-source geographic big data is highly consistent with the actual development of the city, which is helpful to deepen the understanding of urban spatial structure and provides a reference for urban planning.
Rivers play an important part of the earth's water cycle, and it is significant to extract mountain river information accurately for water resource evaluation and ecological restoration. According to Sentinel-2 images from 2019 to 2021, and the multi-spectral index method was used to distinguish rivers, lakes and glaciers automatically by combining with the Random Forest (RF), and MERIT DEM was used as the terrain condition to extract the multi-temporal and high-resolution river automatically. Combined with the second glacier inventory dataset of China, the catchment of different recharge types were divided, the percentage change in river area and width was further calculated to describe the seasonal changing rate. The results showed that the average area of the river in the wet season and the dry season has reached 7 161.64 ± 22.73 km2 and 4 066.02 ± 35.19 km2 during 2019~2021, respectively, and both the Kappa coefficient and the overall accuracy are larger than 0.8. The average seasonal changing rates of river areas of glacier-fed types and non-glacier-fed were 0.34 and 0.23, respectively. The seasonal variation of the average width of glacial-fed rivers was mostly larger than that of non-glacial-fed rivers. The results showed that the changes in width and area of glacier-fed rivers are much larger than that of non-glacier-fed rivers, suggested that glacial meltwater has an important impact on the changes of river runoff.
Atmospheric PM2.5 is one of the primary pollutants affecting air quality. Therefore, how to effectively monitor and manage PM2.5 concentrations is of great significance to the sustainable development of ecological quality in China. Based on a series of auxiliary parameters, i.e., Top-of-Atmospheric reflectance (derived from remote sensing imageries), meteorology, and land use, a Random Forest (RF) model was developed to estimate ground-level PM2.5 concentrations in the contiguous Yangtze River Delta-Fujian (YRD-FJ) region located in East China in 2016, 2018 and 2020. The correlation between the spatial distribution of PM2.5 concentrations and landscape patterns in YRD-FJ region using 3-period land classification data was carried out. The results show that (1) the R2 between the PM2.5 concentrations estimated by the RF model and the ground-level measured values in YRD-FJ region in 2016, 2018, and 2020 are 0.91, 0.89, and 0.90, respectively; the RMSE are 9.07、10.19 and 8.03 μg/m3, respectively. (2) The annual average PM2.5 concentrations in YRD-FJ region showed a trend of year-on-year decrease from 2016 to 2020, and its spatial distribution was generally in the pattern of "Jiangsu > Shanghai > Zhejiang > Fujian". (3) Reasonable control of the landscape proportion of cropland, built-up land and water bodies, and reduction of their landscape dominance and edge density are conducive to alleviating the annual average PM2.5 concentrations. Additionally, appropriate increase in forest occupancy, edge density, and shape complexity are beneficial to reducing PM2.5 concentrations. Our results could provide the scientific basis and decision-making reference for the control of regional air pollution and landscape pattern planning.
Coal resources play a very important role in the national economy, and coal mining will cause many environmental problems, restricting the green and sustainable development of mining areas.The spatio-temporal dynamic monitoring of landscape pattern and ecological environment in mining area can provide decision support for ecological environment governance in mining area, alleviate the contradiction between man and nature, and guide the coordinated development of ecological environment in mining areas.This paper takes Yineng Mining area in Wenshang County, Jining City, Shandong Province as the study area. Based on Landsat images from 2000 to 2021, landscape classification methods, landscape pattern index method, Remote Sensing Ecological Index method (RSEI) and migration of the center of gravity model, the landscape pattern and ecological environment change of Yineng mining area were comprehensively analyzed.The results showed that from 2000 to 2021, the maximum patch index decreased, while the landscape fragmentation and shape index increased. Coal mining had a great impact on the original landscape pattern in Yineng mining area.The ecological environment quality showed a downward trend, upward trend and downward trend.The indexes of greenness and dryness have great influence on ecological environment. The difference grade and excellent grade of Yineng mining area have a large migration range.
The rapid development of Unmanned Aerial Vehicle (UAV) technology provides new methods for geographical research and promotes geographical research into a new stage of development. To understand the application trend of drones in geographical research, 3 911 papers from 2002~2021 were analyzed by bibliometric methods using the relevant literature on the application of drones in geography in the Web of Science core collection as the data source. The results show that the literature on UAV applications in geography has shown a rapid growth trend since 2012, with an annual average growth rate of 54.7%. China and USA dominate the applications of UAV in geographical research. The keyword clustering results reflect the research systems of surveying and cartography, geomorphology, GIS, ecogeography and natural disaster science. Surveying and cartography is currently the most used field for UAV, while GIS and ecogeography have the fastest growth rate. The number of articles issued in the fields of geographic information system and ecological geography has the fastest growth rate, with 73% and 69% growth rate respectively. At present, "UAV+Deep learning" is becoming a major trend in the combination of UAV and geographical research. As scholars strengthen cooperation and communication, more technical and theoretical innovations will emerge from UAV remote sensing to further promote its application in the field of geography.
As one of the main targets in cities, the extraction of buildings is of great importance, and using segmentation methods to separate buildings from the background is the basis for subsequent information extraction. However, traditional Markov Random Field (MRF) model only uses gray information when segmenting buildings in Synthetic Aperture Radar (SAR) images, so the segmentation integrity of gray inhomogeneous targets is poor, and the interrelationship between the two parts of random field energy is not considered, which leads to the results cannot balance regional consistency and edge detail. In order to solve these problems, an improved MRF model for building segmentation in SAR images is proposed. On the one hand, by introducing texture features weighted by the Bhattacharyya Distance into the observed random field, a complete extraction of gray inhomogeneous buildings is achieved; on the other hand, by introducing weights that vary with the number of iterations in the two parts of random field energy, a better noise suppression is achieved while keeping the edges smooth in the dense region, and finally more accurate building segmentation results are obtained. In order to verify the effectiveness and practicability of the proposed algorithm, real SAR images are selected for testing, and the results show that compared with current algorithms, the proposed algorithm has better classification accuracy and Dice coefficient.
Aiming at the problem of poor image classification accuracy caused by low signal-to-noise ratio of hyperspectral images, a hyperspectral image classification method that combines multi-scale low-rank representation and two way recursive filtering is proposed. First, perform superpixel segmentation algorithm on hyperspectral images at different scales to obtain the spatial neighborhood information and segmented images. Next, low-rank representation and PCA(Principal Component Analysis) dimensionality reduction are performed in the segmented regions of each scale, the low-rank representation can impose low-rank constraints on the high correlation between spectra in the segmented regions and remove mixed noise. Then, two way recursive filtering is used to further eliminate noise in the image. Last, according to the classification results of the feature images of each scale by the Support Vector Machine, the final classification is obtained by the majority voting method. The results showed that: Compared with the classification methods using only spectral information (Support Vector Machine and PCA), the overall accuracy of the proposed method is improved by 32.03%, 28.04% and 16.80% on average. Compared with the deep learning classification method of spatial-spectral residual network and vertex component analysis network, the average improvement is 10.99%, 8.45% and 7.08%. Compared with other spatial-spectral classification methods, the average improvement is 8.28%, 18.77% and 10.19%, it is proved that the proposed method can achieve better overall classification accuracy with fewer training samples.
Data-driven modeling is to discover the spatio-temporal evolution of state variables from data. Data-driven data assimilation is a scientific method to optimize the fusion of observation information and model by using data-driven model instead of traditional (physics-based) model. In this work, a data-driven support vector machine regression prediction model is applied to the ensemble Kalman filtering process,and the dynamic system is reconstructed from the sample set by non-parametric sampling of the dynamic system trajectory using the simulation prediction method. A data driven data assimilation method based on support vector machine regression machine learning simulation prediction strategy is proposed and applied to classical pattern driven data assimilation system. The Lorenz-63 and Lorenz-96 model are used for numerical experiments. The data assimilation performance is compared by changing the sensitivity parameters such as sample sizes,noise variance and observation step sizes. The results show that the proposed method is superior to the general sequential data assimilation method for large sample sets,which proves the effectiveness of the new method.
As an important part of the intertidal ecosystem, tidal flats have unique environmental regulation service functions and ecological benefits such as maintaining coastline stability, accelerating material exchange and promoting carbon cycle. Accurate and timely assessment of the status of intertidal wetlands is essential to achieving sustainable management goals. With the help of Google Earth Engine (GEE) cloud computing platform, this paper uses the 2020 Sentinel-2 dense time series remote sensing images, integrates the Maximum Spectral Index Composite algorithm (MSIC) and the Otsu algorithm (Otsu) to construct a multi-layer decision tree classification model, so as to realize the rapid and automatic extraction of Australian intertidal tidal tidal flats. After vectorization, the spatial distribution dataset of high-resolution intertidal flats in Australia in 2020 was obtained, and the extracted tidal flats area was 10 708.22 km2, with an overall accuracy of 95.32% and a Kappa coefficient of 0.94. The dataset is stored in.shp format, with a temporal resolution of years, a spatial resolution of 10 m, and a data volume of 154 m. This data is suitable for coastline management, marine ecological research, environmental protection and monitoring, etc. The data can promote and manage coastal ecosystems, such as mangrove afforestation and control of alien species invasion such as Spartina alterniflora, and can also be used as basic data for scientific research, such as biodiversity, carbon storage estimation and sea level rise caused by sea level erosion etc.
Rapid and accurate extraction of crop type, spatial and temporal distribution is of great significance for agricultural structure adjustment and national food security. However, there are few optical remote sensing image of cloudy areas, thus crop monitoring is limited. To make up this shortage, spectral signature of winter crops and SAR time series characteristics of summer crops were proposed based on the Sentinel-2 and Sentinel-1 data for high-accuracy crop mapping. The Guanghan County, an important grain-producing region in southwest China, was studied. The object-oriented decision tree classification method was explored for spatial and temporal distribution extraction of crops in study area, and the classification accuracy was verified. The results shows that: (1) the main crops in Guanghan County are grain and oil crops, and the major crop rotation patterns are wheat-rice, rape-rice, potato-soybean and potato-corn; (2)the SAR time series characteristics of rice, soybean, corn show clear differences, extracting the types and distribution of winter-summer crops based on the optical-SAR remote sensing images provides a new idea for crops monitoring by remote sensing images in cloudy areas. (3) The overall accuracy and Kappa coefficient of object-oriented method reach 85.49% and 0.81, which can maintain the integrity of large area crops, and avoid salt and pepper noise.
Using remote sensing phenology extraction method has great potential in understanding the sensitivity of farmland phenology to climate change.Used a satellite-derived Normalized Difference Vegetation Index (NDVI) to obtain the spatio-temporal patterns of the farmland phenology in NEC from 2005 to 2020 and validated the results using ground phenology observations. Then explored the relationships among farmland phenology, temperature, precipitation and sunshine hours for relevant periods. The results showed that the spatial distribution pattern of farmland phenology was consistent in Northeast China from 2005 to 2020, and only some areas were different due to the distribution of crop varieties. The temporal variation of farmland phenology was significant.In most regions of NEC, the start date of farmland phenology had advanced by approximately 1 d/a, and the length of vegetation phenology had been prolonged by approximately 1 d/a due to the warm conditions. Farmland phenology was significantly affected by temperature and precipitation, but not by sunshine hours, and was also affected by the change of planting structure to a certain extent.. Moreover, farmland phenology is largely affected by human factors, so some regional climatic factors show opposite trends.
The extreme drought disaster in Jiangxi Province in 2022 severely affected the growth and yield of citrus. It is of great significance to use remote sensing technology to assess the degree of drought damage quickly and accurately for reducing losses of citrus planting and subsequent stabilize yield. The citrus planting areas of Jiangxi Province were identified and extracted by using the 2022 Landsat remote sensing image data, the land use type data of Jiangxi Province, and the Google Earth citrus supervised classification sample point data. On this basis, the Normalized Difference Vegetation Index (NDVI) and Land Surface Temperature(LST) of the key growth period (June-October) of citrus in Jiangxi Province were calculated by using the MODIS data products of 2021 and 2022, which used for joint inversion of Temperature-Vegetation Drought Index(TVDI). Combined with the citrus planting area data of Jiangxi Province Statistical Yearbook and field survey data, the economic losses caused by extreme drought in 2022 in Jiangxi Province were quantitatively assessed under four cases. The results showed as follows: (1) The average TVDI of citrus planting areas in Jiangxi Province from June to October in 2021 and 2022 were 0.83 and 0.62, respectively, and drought stress increased significantly in 2022; (2) Severe drought accounted for 66.1% and moderate drought accounted for 33.7% in the citrus planting area of Jiangxi Province from June to October 2022, and the spatial distribution of drought was more severe in northern Jiangxi Province than in southern Jiangxi Province. (3) From early July to early November 2022, TVDI of citrus planting areas in Jiangxi Province remained above 0.8 for a long time, which was characterized by severe drought. This period coincided with the key growth period of citrus and had a great impact on citrus growth. (4) In 2022, the average reduction rate of citrus yield in Jiangxi Province reached 58.2%, and the economic loss of citrus planting showed an increasing trend from north to south. The direct economic loss of southern, central, and northern Jiangxi Province were 4.964 billion yuan, 4.517 billion yuan, and 1.984 billion yuan, respectively. The research results are helpful for the government to quickly find out the disaster situation of citrus farmers in Jiangxi Province, and provide a certain basis for the decision of citrus planting drought relief, loss reduction, and yield guarantee of citrus planting in the future.
The apple cultivation industry is a pivotal sector for elevating agriculture and enriching farmers in Shaanxi Province. The apple-producing regions on the Loess Plateau face annual demands for blossom period frost protection and yield assessment. Blossom period monitoring is particularly crucial, and conventional methods suffer from high monitoring costs and low accuracy. This study introduces a method based on reconstructing crop reference curves using remote sensing. It compares the accuracy of this method with others applied to common crops. Subsequently, a set of NDVI time series is extracted from MODIS pure pixels identified by geographic national survey land cover classification data. These time series are then used to fit observations similar to Sentinel-2. The method is applied to apple crops in the Loess Plateau region. Based on the spatial phenological differences between the Normalized Difference Vegetation Index (NDVI) sequences of apple sample points (crop reference curve) and the reconstructed apple NDVI sequences, historical high-resolution onset blossom period monitoring results at 10 meters are generated, achieving the transformation of blossom period monitoring from point to area. The research results indicate that the detection results for the onset blossom period of apples in the validation region for the years 2019~2021 have an average absolute error within 1~3 days compared to ground data. The average absolute error is 0.926 days, and the root mean square error is 1.503 days. This method can be used for high-precision monitoring of the apple blossom period, and the predicted results can serve as a reference for frost protection and yield assessment in actual apple production. Additionally, this method can be applied to study the phenological characteristics of other crops such as wheat and maize, promising more accurate decision support for agricultural production.
Remote sensing technology has become an important way to obtain agricultural greenhouse coverage information quickly and effectively. But the spatial resolution size of remote sensing images has a dual influence on the extraction accuracy, and it is important to select suitable resolution images. Taking the southern agricultural plastic greenhouses as the research object, GF-1, GF-2 and Sentinel-2 are used to form six different spatial resolution image datasets between 1 and 16 m. Based on Object-Based Image Analysis (OBIA), we use the Convolutional Neural Network (CNN) and Random Forest (RF) methods to extract the canopy and analyze the extraction accuracy and the difference between the methods. The results show that: (1) the extraction accuracy of agricultural greenhouses under CNN and RF methods generally decreases as the image resolution decreases, and agricultural sheds can be detected on images from 1m to 16 m; (2) the CNN method requires higher spatial resolution than the RF method, and the CNN method has fewer missed and false extractions at 1~2 m resolution, but at 4 m and lower resolutions, the RF method is more applicable; (3) the 2 m resolution image is the best spatial resolution for shed information extraction, which can realize shed monitoring economically and effectively.
Rice-fish co-culture, as a model of modern ecological cycle agricultural, with significant social, economic, and ecological benefits on ensuring stable food production, reducing pollution, improving soil fertility, and lowering CH4 emissions. Therefore, obtaining information on distribution and area of rice-fish fields by using remote sensing technology, is helpful in enhancing the level of agricultural digital management and improving the efficiency of resource utilization efficiency. In this study, we selected the typical rice-crayfish model in the Chengdu Plain for remote sensing identification. First, the time-series data of Sentinel-1 VH polarization backscatter coefficients from 2019~2021 were collected and preprocessed in the Google Earth Engine, to reduce the noise of SAR time-series data. Then the time-series characteristics of typical ground objects were analyzed, including rice-crayfish fields, paddy fields, lotus root fields, orchards, traditional aquaculture, etc, and the characteristic parameters statistical of the backscatter coefficients time-series were statistically analyzed. Finally, the information of rice- crayfish fields, rice fields and lotus root fields were extracted by the classification method of random forest. The results showed that the backscattering coefficients of rice-crayfish fields exhibited typical time-series variation characteristics. Specifically, the annual variation trend of backscattering coefficients began with a smooth transition at low value, then increased rapidly, and finally decreased sharply to low value, due to the state of rice-crayfish fields changed from water body to vegetation and then back to water body. Moreover, the range of coefficient variation and the time of curve peak were significantly different from paddy fields and lotus root fields, respectively. The overall accuracy and Kappa coefficient based on random forest classification were 94.32% and 0.91, respectively. This suggested that time-series data of Sentinel-1 can effectively identify rice-crayfish fields in cloudy regions. The results can provide a reference for remote sensing identification of rice-crayfish fields in cloudy areas.
Leaf Area Index(LAI) is an important indicator to reflect the growth state of crops, which is usually estimated by vegetation index. Traditional inversion models are mostly based on multivariate regression models, while the potential of multivariate regression models based on bivariates in LAI inversion has not been fully explored. By extracting the spectral features and texture features of satellite images, the correlation between each remote sensing feature and winter wheat LAI was analyzed based on Pearson correlation coefficient. Using Simple Regression model (SR), Multiple Linear Regression model (MLR) and Random Forest Regression model (RFR), the relationship between remote sensing characteristics and LAI of winter wheat was studied. The inversion accuracy of each inversion model was determined by the accuracy index (determination coefficient R2, root mean square error RMSE, relative root mean square error rRMSE). Based on the above evaluation indicators, the optimal inversion model was proposed. The results showed: (1) All vegetation indexes and some texture indexes have achieved good inversion results in LAI inversion (R2>0.6). Among them, the Universal Normalized Vegetation Index performed the best among all vegetation indices (R2=0.754,RMSE=0.606,rRMSE=12.99%). Except for the mean feature inversion accuracy of some bands that is comparable to vegetation index, the accuracy of most texture feature inversion for the winter wheat LAI is poor; (2) The bivariate multivariate linear regression model with the highest LAI inversion accuracy for winter wheat was obtained through bivariate combination (R2=0.780,RMSE=0.573,rRMSE=12.29%); (3)In the case of multiple input variables (at least 3 feature variables), RFR performed better than MLR. Compared to texture features, the inversion performance of texture indices was better. The research results can provide a new approach and method for monitoring large-scale crop LAI based on satellite imagery in the future.
The estimation of rice leaf nitrogen content is important to achieve the goals of high rice yield and efficient fertilization in the field. In this paper, we propose a Particle Swarm Optimization-Deep Forest (PSO-DF) model-based method for estimating the nitrogen content of rice leaves, which determines the number of estimation layers in the optimal cascade and the optimal estimator in the Deep Forest (DF) model parameters by a particle swarm optimization algorithm. The number of trees in the optimal estimator is determined by the particle swarm optimization algorithm to improve the regression accuracy of the DF model on Rice datasets.To verify the effectiveness of PSO-DF, this paper used an unmanned aircraft with a hyperspectral image collector to obtain hyperspectral images of Ningxia japonica rice, and sampled, measured, and analyzed the rice leaves at the same period, and extracted the three feature bands with the highest correlation coefficients with rice leaf nitrogen content, which were used as spectral features for inversion with rice nitrogen content data, and compared PSO-DF, the original model DF, and six other common The rice nitrogen content estimation models constructed by machine learning algorithms were compared. The results show that the model constructed by the PSO-DF algorithm outperforms the other models, and its R2 and RMSE indexes are significantly better than those of the other models.
A brief review has been conducted on the progress of typical spaceborne and airborne polarimetric Synthetic Aperture Radar(SAR) systems at home and abroad, for which the implementation of radiometric and polarimetric calibration accuracies has been focused and surveyed. First the general requirements for the polarimetric SAR data calibration accuracy have been drawing from literature research, and then the status quo of representative polarimetric SAR systems in the word and the system data calibration accuracy achievements have been systematically presented, including the relative radiometric calibration accuracy, the absolute radiometric calibration accuracy, the polarization channel crosstalk accuracy, the polarization channel amplitude imbalance accuracy, and the polarization channel phase imbalance accuracy, etc. Finally, the key factors affecting the calibration accuracy of polarimetric SAR data have been analyzed, and the future calibration tasks meeting the new polarimetric SAR system design has been briefly discussed. This paper comprehensively describes the calibration accuracy information index of polarimetric SAR systems and their development status, and provides relevant researchers with timely, comprehensive and systematic information on the development requirements of polarimetric SAR systems and the research progress of calibration accuracy achievements.
Using Sentinel-2 data and multiple methods to invert the permanganate index (CODMn) of deep-water lakes and reservoirs in the Karst Plateau is of great significance for the regional water environment management and enrichment of water quality inversion theories. Taking Hongfeng Lake and Baihua Lake as the research area, based on the Sentinel-2 MSI image and CODMn concentration data, use Random Forest Regression (RFR), Support Vector Regression Method (SVR), Gaussian Process Regression (GPR), Obtaining CODMn spatial distribution in different periods of 2018~2020. The results show that: ① The RFR model has the highest accuracy, the verification set is 0.222 mg·L-1, MAPE is 5.84%, and R2 is 0.841; In addition to the upstream of Baihua Lake, the CODMn concentration of the overall lake is low and there is not much change over time. Studies have shown that the RFR model and Sentinel-2 data are well applicable to monitoring the CODMn concentration monitoring of deep-water lakes in the Karst Plateau.
To explore the application potential of airborne point cloud and UAV visible light image in tree species identification and classification, a single-tree scale tree species classification and recognition method based on UAV hybrid fusion of multi-modal features and decision was proposed. Firstly, Kendall Rank correlation coefficient method and Permutation Importance (PI) were used for feature selection, and Efficient Low-Rank Multi-Mode Fusion Algorithm (LMF) was used to fuse the selected point cloud and visible image features. Ensemble learning was introduced to input point cloud, image, and fusion features into eXtreme Gradient Boosting (XGBoost), Light Gradient Boosting Machine (LightGBM), and Random Forest (RF) base classifiers integrated by Stacking. Finally, the meta classifier, Naive Bayes, is used for decision fusion. The experimental data show that the independent test accuracy of the proposed algorithm is 99.4%, which improves 22.58% compared with the Random Forest classifier by traditional feature concatenate fusion. In addition, the Kappa coefficient also increased by 28.54%. The comparison experiment with Convolutional Neural Network(CNN) shows that the proposed algorithm has obvious advantages in small sample training and better generalization ability.
The study of moso bamboo expansion mechanism can provide a basis for promoting scientific management of forest resources and improving the effectiveness of forest rights system reform. In this study, we selected the quantifiable phenological factors (stand spectral characteristics, stand density and stand leaf area index) in the process of the expansion of moso bamboo into cedar forests, and constructed a comprehensive phenological feature monitoring model to analyze the relationship between the comprehensive phenological feature index and the degree of expansion, so as to reveal the dynamic changes in the expansion of moso bamboo into cedar forests. The acquisition of each phenological factor was carried out by obtaining the stand spectral characteristics and stand leaf area index through vegetation indices of UAV multispectral images; the object-oriented multi-scale segmentation was used to obtain stand density. The results showed that the composite vegetation index, stand density and stand leaf area index of the spectral features of the stand all tended to increase with the degree of expansion, and the yellow factor of the spectral features of the stand tended to increase; the composite index of the apparent features was 0.348×composite vegetation index + 0.054×yellow factor + 0.041×stand density + 0.558×stand leaf area index. The composite index of apparent characteristics was positively correlated with the degree of expansion (R2 = 0.574), and it is reasonable to use the composite index of apparent characteristics to indicate the degree of expansion of moso bamboo, and the composite index of apparent characteristics increased with the degree of expansion.
Phyllostachys edulis is one of the most important and intensively managed forest resources in southern China, Chlorophyll Content Index(CCI) is a crucial indicator of plant health and growth. It is of great significance to realize remote sensing inversion of chlorophyll content in Moso Bamboo forest to monitor the health degree of it. Firstly, three ways of transform including HSV (Hue-Saturn-value) transform、GS (Gram-Schmidt Pan Sharpening spectral Sharpening method) transform and PCA (Principal Component Analysis) were used to make sure that Landsat 8 multispectral image and Unmanned Aerial Vehicle (UAV) high resolution single-band image data were fused well together. Secondly, 8 kinds of vegetation cover indices were then constructed based on multi-source remote sensing data, moreover, three machine learning models including K-nearest Neighbor (KNN) regression, Random Forest (RF) regression as well as CatBoost regression were applied to ensure vegetation index and chlorophyll content could be fitted. Finally, the inversion model of chlorophyll unit content in Moso Bamboo forest was then established. The results indicated that :(1) In terms of fusion effect, it turned out that GS was the optimal model cause various evaluation parameters derived from it such as mean value、standard deviation、mean gradient joint entropy and spatial frequency were all the highest, which were 73.407 8、80.672 9、29.699 2、9.765 5 and 74.876 9, respectively. (2) In the validation set based on fused multispectral data, Landsat 8 multispectral data and UAV data, RF algorithm turned to be the best algorithm(RF algorithm's corresponding R2 is 0.687 6、0.576 1、0.425 4, respectively, while the corresponding RMSE were 2.918 4 μg/cm2、3.559 5 μg/cm2、3.974 5 μg/cm2, respectively). (3) The inversion effect of chlorophyll content could be better when based on fusion data than Landsat 8 data and UAV data. This study coupled with multi-source remote sensing data to realize remote sensing retrieval of chlorophyll content in Phyllostachys pubesculus forest, which can provide scientific reference for dynamic monitoring of phyllostachys pubesculus forest health.
Mangrove forests are among the ecosystems with the highest net primary productivity in the world, and they play an important role in the study of global climate change and the evolution of coastal zone geography. Rapid and accurate acquisition of the spatial distribution of mangroves on a large scale is vital for effectively managing and exploiting mangrove resources. Landsat satellite images have become an important data source for extracting large-scale and long-period mangrove distribution information. Yingluo Bay and Pearl Bay along the coast of Guangxi, China are selected as the study sites in this study. Landsat-8 OLI images are used to construct five indices to extract the distribution of mangroves, including Normalized Difference Mangrove Index (NDMI), Combined Mangrove Recognition Index (CMRI), Modular Mangrove Recognition Index (MMRI), Mangrove Index (MI) and Mangrove Vegetation Index (MVI). This study compared the efficiency of different indices used for mangrove extraction to determine the optimal mangrove extraction index. Optimizing the mangrove distribution information extraction is proposed by combining Normalized Difference Water Index (NDWI) index. The aim is administrator improve the remote sensing classification accuracy of mangroves. It is also applied to the extraction of coastal mangroves in Guangxi. The results showed that: Mangrove distribution can be effectively extracted based on Landsat-8 OLI satellite images and index method. By comparing the extraction accuracy of five indices of mangroves, we found that the MVI has the best extraction effect and the CMRI has the worst extraction effect. The combination of NDWI can better optimize the extraction accuracy of mangroves, and the optimized MVI applied to Guangxi coastal mangroves showed the best extraction results with an overall accuracy of 97.10%. The research strategy and the range of mangrove index thresholds in this paper can provide reference and decision support for large-scale mangrove distribution extraction.
The Light Detection and Ranging (LiDAR) has been widely used in forest inventory. It is quite difficulty to describe the complex vertical structures of forest using the terrestrial or Unmanned Aerial Vehicle (UAV) LiDAR or laser scanning, individually. The complete spatial structure of forest can be obtained by combing the Terrestrial Laser Scanning (TLS) and UAV Laser Scanning (ULS). The TLS and ULS point cloud were registered and fused to extract the trunks of individual trees. The random Hough transform was used to fit the point cloud of the trunk in segments. The taper equation was fitted using the diameters of trunk segments and the differential quadrature method was used to calculate the volumes of individual trees. The volumes of individual trees were accumulate to get plot volume. Compared with the calculated value of the binary volume model, the results showed that the accuracy of calculating the volume of individual tree based on the fusion point cloud was better than that of the terrestrial point cloud, the R2 can be increased by more than 2%, and the RMSE can be reduced by 0.01 m3. The R2 and RMSE were 0.98 and 0.87m3 for the plot volume, which calculated by the combination of taper equation and differential quadrature method. Among them, the R2 and RMSE of Cunninghamia lanceolata volume were 0.96 and 0.07 m3, for Eucalyptus, the R2 and RMSE were 0.93 and 0.07 m3. Among the three types of plots: easu, medium, and difficult, the volume R2 of Cunninghamia lanceolata and Eucalyptus in easy and medium plots were all above 0.94, the RMSE was about 0.07 m3, but the R2 of the volume results in difficult plot was below 0.9. The TLS and ULS fusion point cloud can more finely measure the forest spatial structure, and better meet the needs of forest resource survey applications.
Compared with the traditional manual field survey method, the use of UAV tilt photogrammetry technology for multiangle photography to extract individual tree crown information has the advantages of high efficiency, accuracy and low cost. In this study, an individual tree crown extraction method combined with a visible vegetation index and watershed algorithm was proposed by taking a larch near-mature forest in the Wangyedian forest farm in southwestern Karaqin Banner, Chifeng city, Inner Mongolia, as the research object and using UAV images obtained by tilt photogrammetry as the data source. First, the Excess Green minus Excess Red (ExGR) in the visible light band was calculated by a digital orthophoto model. The median filter was used to denoise the tree crown area map, and a reasonable threshold was selected to binarize the image to separate the vegetation and non-vegetation areas. Vegetation areas were used to mask the canopy height model. Finally, the accuracy of individual tree crowns was verified by the watershed segmentation algorithm. In the process of extracting the crown area, vegetation and non-vegetation areas are successfully separated based on the ExGR index and threshold method. Through median filtering, speckle and noise caused by uneven brightness, shadow and texture in the non-vegetation area are effectively removed, the integrity of the crown edge and the connectivity of the crown are ensured, and the over segmentation phenomenon of the watershed algorithm is reduced. At the individual tree scale, the accuracy rate of crown parameter information extraction was 88.72% and 79.38%, the recall rate was 93.29% and 88.60%, and the F-score was 90.59% and 83.74%. On the sample plot scale, the relative errors are 15.45% and 22.92% respectively. The results show that the visible vegetation index based on Digital Orthophoto Image can effectively eliminate the influence of bare land and other background factors in the forest, and the watershed segmentation algorithm based on the canopy height model can accurately distinguish individual tree information. The combination of the two data sources based on the UAV tilt photogrammetry technology gives full play to their respective advantages. The method of extracting the single tree crown information based on the UAV tilt photogrammetry technology is feasible and can extract the single tree crown information of the forest with high canopy density efficiently and accurately.
The correlation between the mathematically transformed spectral data including the original spectrum of soil and the heavy metal content was analyzed, and then the VISSA-IRIV algorithm was used for spectral feature extraction, and Partial Least Squares Regression (PLSR), BP Neural Network(BPNN), particle swarm optimization BP neural network, genetic algorithm optimization BP neural network models were developed to compare and obtain the optimal inversion models of Cr and Cu contents of soil heavy metals. The results showed that the VISSA-IRIV algorithm achieved efficient dimensionality reduction of the spectral data; the prediction effect of the BPNN model was significantly better than that of the PLSR model; the inversion accuracy and stability of the optimized BP neural network models were greatly improved, and the best inversion model combinations for Cr and Cu elements were FD-GA-BPNN(R2=0.87,RMSE=13.82,RPD=2.95),and SNV-FD-PSO-BPNN(R2=0.92,RMSE=4.25,RPD=3.41), respectively. This study provides an effective method for the accurate and rapid analysis of soil heavy metal content, which is of great practical significance for the realization of soil heavy metal pollution control.
The use of UAV hyperspectral remote sensing data technology to quickly and accurately extract typical grassland vegetation types is of great significance for dynamic monitoring of grassland ecological security.In the typical grassland area of Baiyinxile pasture with severe degradation, hyperspectral images with a spatial resolution of 1.8 cm and a spectral resolution of 4 nm, with a total of 125 bands (450 nm to 950 nm) were collected. The main degradation indicator species, Artemisia cholerae, was selected as the identification target, and after differential transformation, envelope removaland other spectral transformations, the differences in spectral characteristics were analyzed. There are obvious spectral differences at 500 nm、550 nm、670 nm, so the above three bands were selected as characteristic bands, and the degradation indicator species identification model of Support Vector Machine (SVM) and Random Forest (RF) was constructed, and the accuracy was verified. The results show that the recognition accuracy of SVM and RF are 96.92%和97.34%, respectively, and the Kappa coefficients are 0.95 and 0.96, respectively. It can be seen from the results that the identification accuracy of the random forest model is higher, and the pixel spatial distribution of degraded indicator species is closer to the natural state, which can provide technical support for monitoring typical grassland degradation indicator species.
Forest is a valuable non-renewable resource, but the ecological environment of forest is seriously threatened by many natural or man-made factors such as fire, flood, and deforestation interference. Accurate grasp of forest resource changes can provide effective information for forest resource management and protection. In the task of forest change detection, traditional machine learning change detection methods have difficulty in capturing deep semantic information due to large differences in forest categories and tree species, and suffer from poor adaptability of extracted features, weak recognition ability, and pseudo-change due to seasonal phases. We propose to build a deep learning model with Siamese neural networks for forest change detection experiments. Three different feature extraction methods, ResNet50 (Residual neural network), CBAM (Convolutional Block Attention Module) and SE (Squeeze and Excitation) with different lightweight attention mechanisms are used as backbone feature extraction modules, respectively. All three backbone feature extraction networks are trained based on pre-trained weights, which improve change detection by fusing the extracted multi-scale feature maps so that the coarse and fine details of information in different feature maps complement each other. It also has the advantage of sharing weights with the same number of parameters. Taking Jiande Forest Farm in Zhejiang province as the experimental area, two phases of GF-2 images in 2015 and 2020 are acquired to construct a forest change detection dataset with a resolution of 1m. The results of Siamese neural network change detection are compared with the true change labels (Ground truth), where the backbone feature extraction network SE-ResNet50 has the best combined results with Precision (0.91), Recall (0.78) and F1-score (0.83), which is better than mainstream change detection models FC-Siam-conc, FC-Siam-diff. It is proved that Siamese neural networks can accurately capture forest changes in the task of forest lad change detection from high-resolution remote sensing images, and provide a new forest change detection method for forest resource management departments.
In the ' post-poverty era ' of 2020, the four prefectures in southern Xinjiang are still underdeveloped areas in the development pattern of the whole country and in Xinjiang.Therefore, it is of great significance to carry out long-term economic measurement and development analysis of the four prefectures in southern Xinjiang. However, the traditional measurement methods using socio-economic data have great limitations.The nightlight remote sensing data is used to objectively invert the economic development characteristics of the poverty-stricken area.This paper selects four prefectures of southern Xinjiang as the study area, and corrects NPP/VIIRS and DMSP/OLS data for noise and supersaturation respectively, based on the integration of two kinds of night light data, the correlation between the total night light amount of 33 counties (cities) and the secondary and tertiary industries was used, the spatial and temporal pattern of economic development in the four regions of southern Xinjiang from 2005 to 2020 was studied by using standard deviation ellipse and Molain index.The results show that : (1) From 2005 to 2020, the economic center of gravity moved to the northwest. The total economy is dominated by the northeast-southwest direction, the economic development trend is more and more concentrated and contiguous.(2) There has been a high spatial autocorrelation and aggregation during the study period, mainly showing H-H and L-L gathering areas. The higher the economic level of the region, the more prone to aggregation.(3) The probability of occurrence of cold spots and hot spots in regional economic development in the four prefectures of southern Xinjiang has obvious local characteristics. The coordinated economic development among the four regions of southern Xinjiang should be the policy focus.
Quickly and accurately obtaining information on the area of special plant planting plots is of great significance for drug production estimation and prevention of drug criminal activities. Aiming at the problem that existing special plant planting plot detection algorithms in high-resolution remote sensing images cannot quickly obtain location information and area information at the same time, this paper proposes an improved PSPNet semantic segmentation model suitable for quickly and accurately extracting certain special plant planting plots. . By introducing the channel attention SE module, the problem of holes in the segmentation of a certain special plant planting plot is solved. The Dice Loss loss function is added to improve the problem of imbalance of positive and negative samples. The encoder-decoder structure is introduced to make the extracted special plant planting Lot outline boundaries are more precise. By using the MobileNetv2 backbone network, the model prediction speed is increased by 90%. The improved I-PSPNet model achieved 95% and 84% MPA and 84% MIoU in the extraction of a special plant planting plot, and the detection efficiency reached 84 fps. Comparative experiments between I-PSPNet and UNet, Deeplabv3+, and PSPNet show that the prediction accuracy and speed of the improved model are better than the above three models. Among them, MPA increased by 24%, 7.4%, and 7.7%, and MIoU increased by 24%, 7.4%, and 7.7%. 19%, 4.3% and 4.9%, predicted speed improvements of 57 fps, 56 fps and 40 fps. At the same time, the improved model also has good applicability to RGB band data sets and GF-2 images. The improved model proposed in this article can be used to quickly and accurately obtain the location information and area information of a special plant planting plot, and help the anti-drug department quickly discover the illegal planting of a special plant planting plot, objectively assess the scale of illegal planting, and implement precise crackdowns on illegal drug and criminal activities. Provide technical support.
As a "New Blue Ocean" for urban consumption to increase employment, boost consumption and drive regional development, the night economy has gradually become a research hotspot in the "Post-Pandemic era". The “nighttime economic agglomeration center” is the core and foundation of the nighttime economic development, and there is no systematic studies available at home and abroad. As a social economic element, it has the characteristics of non-uniform symmetry and "grey clustering", so it cannot simply apply the traditional geographical clustering center identification method. Based on the theory of "point-axis system", this paper proposes a method to identify and extract the nighttime economic agglomeration centers, and uses the Geo-information Tupu of generalized symmetric to deconstruct the spatial pattern and differentiation mechanism of the nighttime economic agglomeration centers in downtown Shanghai. For the first time, this paper provides a systematic method reference for rapidly and accurately identifying the nighttime economic agglomeration centers and scientifically exploring their spatial distribution characteristics, and provides decision support for promoting the prosperity and sustainable development of nighttime economy. The results show that: within the central city of Shanghai, a total of 12 first-class nighttime economic agglomeration centers and 26 second-class nighttime economic agglomerations were extracted, and the average vitality values of the night-time economy were: 0.49 and 0.24, respectively. Conclusions (1) The method proposed in this paper can quickly identify and extract nighttime economic agglomeration centers; (2) The Shanghai nighttime economic agglomeration centers present a "center-periphery" spatial distribution pattern, forming a distinct hierarchical system; (3) The degree of infrastructure perfection and the distance from the city center are the main driving factors for the differentiation of Shanghai nighttime economic agglomeration; (4) The "Color Symmetry" distribution spatial pattern of the agglomeration center indicates that the night economy of Shanghai in a reasonable and sustainable development stage. In the future planning,it can be expanded and filled internally along Metro Line 2. The central connecting line of the agglomeration symmetry can also be used as the development axis to upgrade the nighttime economic agglomeration effect in the form of "Agglomeration Area".
Remote sensing technology has played an important role in the emergency response of major natural disasters. However, the existing global emergency response mechanism based on remote sensing data still has problems such as insufficient data sharing, complex start-up procedures, and low response efficiency. It is urgent to establish an efficient, stable and sustainable remote sensing disaster emergency mechanism. This paper systematically reviews the value of multi-source remote sensing data in disaster emergency response and the shortcomings of the current international emergency response mechanism for major natural disasters. Based on the shared resource database of large-scale multi-source remote sensing data and the one-stop service collaboration method, the theoretical framework of China GEO Collaborative network of Disaster Data Response (CDDR) mechanism is proposed. It has also been applied in emergency response to disasters such as Tonga volcanic eruption and Turkey earthquake. Through two representative application cases, it can be seen that the mechanism has improved the efficiency of disaster emergency response services from various aspects such as data collection, download, analysis and application, and effectively supplemented the shortcomings of the existing mechanism. The new mechanism has simplified start-up procedures, enhanced data aggregation capabilities, more professional disaster assessment capabilities, and more accurate sharing capabilities, which is expected to provide stable and sustainable sharing services for the international community.
Vegetation phenology is an important biological indicator for monitoring terrestrial ecosystems and global climate change. The monitoring of land surface phenology based on classical remote sensing vegetation indices is more challenging in terms of accurate analysis of different vegetation types. Solar-Induced Chlorophyll Fluorescence (SIF) is more sensitive to the seasonal dynamics of vegetation and can more accurately portray the interannual variability of vegetation. Based on the 2001~2020 GOSIF dataset, this study extracted the vegetation phenology parameters in Northeast China by D-L fitting function and dynamic threshold method, combined with unitary linear regression analysis, stability and sustainability analysis, this study analyzed the spatiotemporal evolution characteristics, stability and sustainability of vegetation phenology in Northeast China from 2001 to 2020 at multiple spatiotemporal scales, and explored the response mechanism of vegetation phenology to climate change. The results showed that SOS, EOS, LOS, and POP showed advanced, delayed, prolonged and advanced, respectively. The trend of SOS advance and EOS delay in grassland was significant, and EOS of coniferous forests was advanced. The advance of SOS and the delay of EOS led to the prolongation of LOS. Except for coniferous forest, all vegetation types showed an extended trend of LOS. All vegetation types POP showed an advance trend, except for grassland and steppe. The changes of SOS, EOS, LOS and POP were relatively stable in the past 20 years, and the coefficients of variation were all less than 0.1. The H values of SOS, EOS, LOS and POP in most regions ranged between 0.35 and 0.5, indicating that the trend was opposite to the past and would show a slight trend of delay, advance, shortening and delay. Overall, the influence mechanism of temperature and precipitation was opposite on vegetation phenology, that is, higher temperature (increased precipitation) led to advance (delay) of SOS and POP, delay (advance) of EOS, and lengthen (shorten) of LOS. There was a negative correlation between relative humidity and vegetation phenological parameters. The results of this study help to understand the spatiotemporal pattern changes of photosynthesis in vegetation and the response mechanism to climate change, and also provide reference for the assessment and management of ecological environment in Northeast China.
The Gaofen-6 medium resolution wide-width camera (GF6-WFV) is designed with two red-edge bands, which has the potential to monitor chlorophyll a concentration in water. In this study, six typical lakes in eastern China, including Guanting Reservoir, Luhun Reservoir and Baiyangdian Lake, were selected as the study area, and measured spectrum and chlorophyll a concentration data were obtained from 141 sampling points. Based on the measured data, the parameters of four kinds of commonly used semi-empirical inversion models of chlorophyll a concentration were optimized and the model accuracy verified, and the optimal inversion model was selected. The results show that the red edge band Ⅰ (B5:710 nm) and red band (B3: 660 nm) are newly added in GF6-WFV data. Which construct a two-band ratio 2BDA model with high inversion accuracy, correlation coefficient square (R2) is 0.89, the Mean Relative Error (MRE) is 34.71 %, and the Root Mean Square Error (RMSE) is 13.29 mg/m3. The results show that the chlorophyll a concentration in water body can be effectively retrieved by using GF6-WFV image data. The inversion model of chlorophyll a concentration in water body established in this paper based on multi-lake and multi-temporal data has good applicability in typical lake repositories in eastern China.
Unmanned Airborne Vehicle (UAV) based multispectral remote sensing has the advantages of low cost and flexible time in monitoring small water bodies. However, the common multispectral cameras have the problems of few pixels and lack of characteristic bands of inland water bodies, which limit the advantages of UAV based multispectral remote sensing in monitoring the water environment. In order to solve these problems, this study customized the bands for inland water quality monitoring for the Aerospace ShuWei KP-8 multispectral camera with high pixel, including 670 and 700 nm bands for inland water chlorophyll a retrieval; Then, a flight experiment was carried out to obtain the multispectral image of the turbid and eutrophic Luhun Reservoir. And the synchronously obtained water quality parameters from the water surface experiment were used to build the retrieval models of the typical water quality parameters, including the Secchi-disk depth, turbidity, suspended solids and chlorophyll a concentration; The retrieval models were applied to the multispectral image, and the typical water quality parameters in Luhun Reservoir were retrieved and their spatial distribution rules were analyzed. The results show that the UAV based high pixel multispectral camera has important potential in the operational monitoring of inland water environment.
Groundwater quality is becoming increasingly polluted and monitoring the content of groundwater ionic compounds is beneficial for dynamic groundwater management and accurate prevention. Little is known about the weak spectral response and inversion mechanisms of ionic compounds, and most existing studies have performed simple qualitative analyses of ionic compounds, with less use of mathematical and statistical methods for comprehensive estimation of their content. Based on the spectral mechanism of ionic compounds and the redundant nature of hyperspectral data, the spectral response mechanism of three ionic compounds in water, the optimal pre-processing method and the algorithm of feature band selection were investigated by measuring the visible-near infrared reflectance spectra (400~1 000 nm) of three ionic compound standard solutions with different concentrations of sodium, potassium and calcium in the laboratory. And based on the characteristic spectral bands, a BP neural network model is constructed to quantitatively invert the ionic compound content. It was found that (1) The overall reflectance of the three ionic compounds is inversely proportional to the content at wavelengths from 400 to 1 000 nm and proportional to the charge number and radius of the ions; (2) Compared with the continuous projection method, the multiple linear regression model constructed based on the characteristic spectral bands extracted by principal component analysis can better infer the content of ionic compounds in water bodies; (3) The preprocessing of the KCl optimal inversion model by SG filtering and the preprocessing of the CaCl2 and NaCl optimal inversion models by SG filtering followed by reflectance normalization; (4) Compared with the traditional linear inversion model, the PCA-BPNN nonlinear model achieves the best inversion results, among which the inversion results of potassium ion compound content are the best, with the R2 and RMSE of the training set reaching 0.996 4 and 248.77, respectively, the R2 and RMSE of the test set reaching 0.998 8 and 156.89, respectively. This study can provide important theoretical and technical support for groundwater ionization inversion.
The concentration of chlorophyll-a is a key indicator for evaluating the eutrophication of coastal water, and the research on the influencing factors of coastal chlorophyll-a is significant to marine environmental protection. However, the existing studies mostly focus on the effect of natural factors on the concentration of chlorophyll-a in coastal waters, ignoring the human activities. Therefore, this paper uses nighttime light brightness to characterize the intensity of human activities, and divides cities on the southeastern coast into three types based on its relationship with coastal chlorophyll-a concentration, and also combines sea surface temperature, wind speed, solar radiation, precipitation and human factors, using the Generalized Additive Model (GAM) to analyze the impact of multiple factors on coastal chlorophyll-a concentration in three types of cities in different seasons. The results show that the change of chlorophyll-a concentration was dominated by natural factors in type I cities such as Fuzhou and Shantou, the dominant factor in spring is wind speed, and the sea surface temperature in summer, autumn and winter; while human activities have little effect. Type II cities such as Zhuhai and Dongguan are dominated by natural factors. The dominant factor is wind speed in spring, autumn and winter, and the sea surface temperature in summer; human activities have a greater promoting effect in summer and autumn. Type III cities such as Shenzhen and Hongkong are dominated by human factors. Human activities have the greatest impact on chlorophyll-a concentration in spring, summer and autumn and they are a negatively correlated. In winter, sea surface temperature has the greatest impact.
In view of the high cost of traditional river water quality monitoring and the sparse ground monitoring stations, based on Sentinel-2 satellite multispectral remote sensing data, combined with MODIS surface temperature, vegetation index, aerosol optical thickness data products, and the surface wind speed data in ERA5 meteorological data products, the monitoring data of the surface water quality monitoring stations with non-optical active parameters Dissolved Oxygen (DO), Chemical Oxygen Demand (COD) and ammonia nitrogen (NH3-N) are taken as reference, three machine learning methods, Support Vector Regression (SVR), Random Forest (RF) and Multilayer Perceptron (MLP), were used to select the optimal inversion model of each water quality parameter and its corresponding input feature combination through comparative experiments. The experimental results of the model performance test show that the determination coefficients (R2) of DO, COD and NH3-N are 0.896,0.781 and 0.529, respectively,and the Root Mean Square Error(RMSE) are 0.263 mg/L,0.383 mg/L and 0.061 mg/L, respectively. Compared with the retrieval results using only Sentinel-2 multi-spectral remote sensing data, R2 increased by 7.04%, 19.05% and 18.34% respectively, and RMSE decreased by 34.58%, 37.42% and 14.08% respectively. It shows that multi-source remote sensing and meteorological data are of great significance to improve the retrieval accuracy of DO, COD and NH3-N water quality parameters. Finally, the model robustness evaluation experiment shows that the trained model has better space-time robustness when the representativeness of the model training data is close to the global data.
This study, focused on the area of Beibu Gulf, explores the remote sensing inversion method for chlorophyll concentration based on the Sentinel-3A satellite's OCLI water color sensor. The study partitions the Beibu Gulf by using measured spectral data and then combines the measured chlorophyll-a concentration with Sentinel-3A remote sensing data of which aims to build the remote sensing inversion model for chlorophyll-a concentration. The results show that (1) the remote sensing reflectance curves exhibit distinct partition characteristics, dividing the area into nearshore, transitional, and offshore water types based on the spectral features; (2) Different water types require different inversion factors for model construction, and all of them got relatively good fitted result. Among them, the fitted inversion factor is Rrs(764.375)/Rrs(681.25) that could be used in the nearshore water, for the transitional water, [1/Rrs(620)-1/Rrs(708.75)]/Rrs(753.75) is the most suitable, and for the offshore water, Rrs(708.75)-Rrs(764.375) achieves the best fitting performance, with corresponding R2 values of 0.67, 0.80, and 0.8, respectively; (3) The partitioning method effectively improves the applicability and accuracy of the remote sensing inversion model for chlorophyll concentration in the Beibu Gulf. This study successfully realizes the remote sensing inversion of chlorophyll concentration in the Beibu Gulf by using a partitioning model based on Sentinel-3A satellite's OCLI data. The result provides the important scientific support for the remote sensing monitoring of chlorophyll concentration in the Beibu Gulf, and enhances the management and protection of marine ecological environments.
In recent years, in order to improve the classification accuracy of ground objects, break through the technical system of single sensor, and make up for the limitations of single data source application, multi-source remote sensing data fusion has become a research hotspot concerned by many scholars in the field of remote sensing. The fusion technology of optical image and LiDAR point cloud data of hyperspectral remote sensing technology provides a feasible scheme to improve the accuracy of ground object recognition and classification at the technical level, breaks the technical upper limit of single sensor, and provides a new solution for the integrated acquisition of target three-dimensional space-spectral information. At the same time, it lays a foundation for the research of hyperspectral LiDAR imaging technology. This paper reviews the development history of LiDAR and hyperspectral imaging data fusion, discusses the main fusion methods and research progress at the feature level and decision level, introduces the commonly used feature level fusion and decision level fusion methods in detail, summarizes the latest research algorithms and discusses their challenges and future development and application prospects. Finally, the future development of LiDAR and hyperspectral imaging data fusion is prospected systematically.
In recent years, the abundance of hydro fluorocarbons (HFC) has been increasing, which has huge greenhouse potential value. It has an impact on global warming and also indirectly causes the destruction of the ozone layer. Scholars at home and abroad have carried out a wide range of in-situ ground measurements to obtain global abundance. At the same time, remote sensing technology can monitor the changes of HFC gas in a large range, for a long time and quickly, and has become an important means for the inversion of the gas concentration. The contents of in-situ measurement method, tracer ratio method, satellite inversion sensor development and satellite inversion method are described, and the advantages and disadvantages of different inversion methods are compared in combination with load characteristics analysis. Finally, discusses and prospects the existing problems and future development trend of current inversion.